This is a small tool to perform microbenchmarks (performance comparison of small code snippets) for .NET, Default output report looks like this but you can customize it in the way you prefer (or export gathered data to be analyzed in Microsoft Excel):
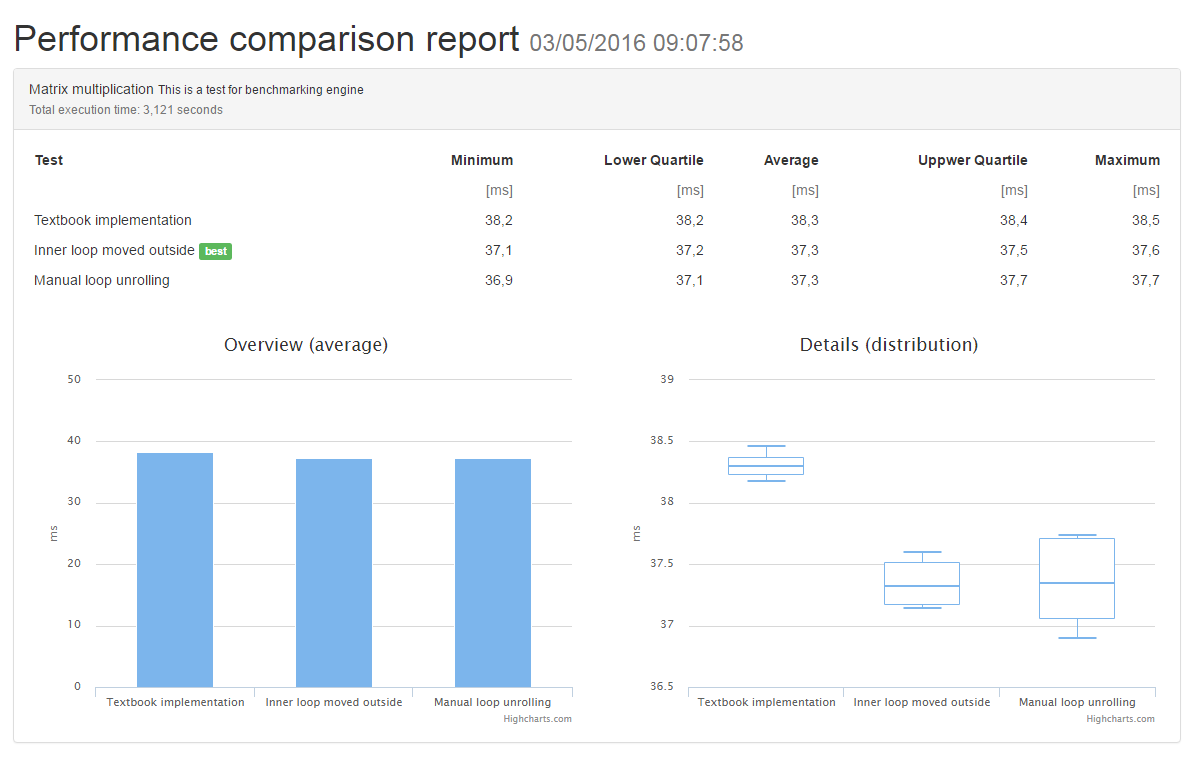
It is not magic then do not expect you can write algorithms you want to compare and blindlessly run this benchmark to get meaningful results: you will not. That said this tool is useful to have a first rough idea of code performance and get results in an easy to understand graphical format (if you always just checked average execution time then take a look to above charts, dispersion is as important as average). Before writing your tests and trying to analyze results you should read one good tutorial about microbenchmarks, especially to understand their limits. Also don't forget that this tool is not intended to facilitate output quality measurement but merely its computation performance.
Note that the same infrastructure may be used also to perform other performance tests which involves, for example, I/O which are usually excluded from microbenchmarks. There are more complete and sophisticated tools to perform such tests (because you probably also need to interpolate measures with system performance and resources) but you may use this tool also to perform a first indicative analysis.
##First Benchmark To write your first benchmark you have to write a discoverable class:
public class MyBenchmark {
  public void Test1() { /* Code for algorithm 1 here */ }
  public void Test2() { /* Code for algorithm 2 here */ }
}
Now you can run that benchmark, render its output to HTML and display results simply with this (don't forget to add a reference to MicroBench.Engine.dll):
class Program {
  static void Main() {
    Process.Start(BenchmarkEngine.ExecuteAndRenderWithDefaults());
  }
}
If you need a quick benchmark you may simply edit Benchmark.cs in Tests/ManualTest.exe, it is a console application
with the sole purpose to show you how to use this tool.
Do you want to write your own fancy user interface to quickly write tests? Don't forget to also take a look to
BenchmarkEngine.SuiteProgressChanged and BenchmarkEngine.BenchmarkProgressChanged events, tests may take a long
time to run and users should be informed about what is going on.
##Unit Testing Integration
Sometimes you need to measure performance in your unit testing, you have some simplified methods for this:
[TestClass]
public sealed class BackendTests {
    [TestMethod]
    public void MaximumExecutionTimeIs10Milliseconds() {
      Assert.IsTrue(BenchmarkEngine.ExecuteSingle(typeof(Benchmark)) <= TimeSpan.FromMilliseconds(10));
    }

    sealed class Benchmark {
      public void Test() {
        // Write here code you want to test
      }
    }
}
In this library I did not want to be tied to a specific testing framework but note that you may write your own finder class to extract all methods to benchmark (and eventually their performance specifications). Something similar to this:
[TestClass, Benchmark]
public sealed class BackendTests {
    [TestMethod]
    public void PerformanceConstrainedDataProcessing() {
        var engine = new BenchmarkEngine(new BenchmarkOptions(),  new Type[] { typeof(BackendTests) });
        foreach (var benchmark in engine.Execute()) {
            // Validate PerformanceContrainedAttribute constraints...
        }
    }

    [BenchmarkedMethod, PerformanceContrained(Maximum: 10)]
    public void PerformSomeDataProcessing1() {
      // Write here code you want to test
    }

    [BenchmarkedMethod, PerformanceContrained(Average: 2, MaximumDrift: 5)]
    public void PerformSomeDataProcessing2() {
      // Write here code you want to test
    }
}Logic is simple and straightforward:
- Each class is a separate benchmark and each method is a test which
will be compared to all the others within the same class. You can specify a search strategy
using
BenchmarkEngineOptions.SearchMethod: classes and methods may be marked with attributes or simply using a naming convention. - Each method is then executed many times and its execution time is recordered. Using
BenchmarkOptions.RepetitionsorBenchmarkedMethodAttributeyou can specify how many measures you want to perform. By default each execution is performed in a separateAppDomainto minimize interference between tests. To use attributes you need a reference toMicroBench.dll. - These measures are then aggregated to produce some indices. You need to specify which calculations you want
to perform, this tool ships a simple
BasicStatisticsclass with a minimal statistical analysis. - All collected data is then rendered into an output file. You can use any
OutputRendereryou want; default output format is HTML implemented inHtmlOutputRendererand you can customize output appearance using an HTML (Mustache powered) template.
Full code for previous benchmark without using the BenchmarkEngine.ExecuteAndRenderWithDefaults() helper method is:
string templatePath = Path.Combine(Environment.CurrentDirectory, HtmlOutputRenderer.DefaultReportName);
string outputPath = Path.Combine(Path.GetTempPath(), HtmlOutputRenderer.DefaultReportName);

var options = new BenchmarkOptions { SearchMethod = BencharkSearchMethod.Convention };
var engine = new BenchmarkEngine(options, new Assembly[] { typeof(Program).Assembly });

var renderer = new HtmlOutputRenderer();
renderer.TemplatePath = templatePath;
renderer.Statistics = new BasicStatistics() { CutTails = true };
renderer.RenderTo(outputPath, engine.Execute());

Process.Start(outputPath);
##Benchmarks and Tests
One single code snippet to measure is called test and it must be a void public non-virtual parameterless instance method.
When searching by convention it may be named starting with Test but if engine can't find any eligible method
within a class then it will pick any eligible method regardless its name.
public void TestDixon() { }When search is performed using a declarative syntax then each method you want to measure
must be decorated with BenchmarkedMethodAttribute.
[BenchmarkedMethod]
public void Dixon() { }
By default test display name is method name but you can change it using BenchmarkedMethodAttribute.Name property
and optionally a description may be added (where and how its displayed is left to output renderer implementation).
[BenchmarkedMethod(Name="Dixon's algorithm", Description="See en.wikipedia.org/wiki/Dixon%27s_algorithm")]
public void Dixon() { }

[BenchmarkedMethod(Name="Shor's algorithm", Description="See en.wikipedia.org/wiki/Shor%27s_algorithm")]
public void Shor() { }
Using BenchmarkedMethodAttribute you can also override defaults for BenchmarkEngineOptions.WarmUp and
BenchmarkEngineOptions.Repetitions but you probably will never need it.
All discovered methods are grouped into a benchmark and compared to each other. A benchmark is a public non-abstract, non-generic class with a default constructor.
When searching by convention a class must begin or end with Benchmark.
public sealed class IntegerFactorizationBenchmark {
  public void TestDixon() { }
  public void TestShor() { }
}
When search is performed using a declarative syntax then each class must be decorated with BenchmarkedAttribute.
[Benchmark]
public sealed class IntegerFactorization {
  [BenchmarkedMethod]
  public void Dixon() { }

  [BenchmarkedMethod]
  public void Shor() { }
}
Also for BenchmarkAttribute you can use Name and Description to provide additional information.
Multiple benchmarks can be grouped together into a suite but measures are not correlated.
If you need to initialize some data for your tests (and eventually perform some clean-up) you can freely mix one or more of these:
- To setup: declare a default constructor.
- To setup: declare one or more public
voidand parameterless instance methods (can be virtual) and mark it withSetUpBenchmarkAttribute. Execution order is not granted. - To cleanup: implement
IDisposable. - To cleanup: declare one or more public
voidand parameterless instance methods (can be virtual) and mark it withCleanUpBenchmarkAttribute. Execution order is not granted.
Setup (and symmetric cleanup) code will be executed for each run of each method, don't forget it if you have to perform some very expensive initialization code. Code is executed each time in separate a new AppDomain then you can't share resources between instances. To workaround this (unless you want - but you shouldn't - set BenchmarkEngineOptions.RunInIsolation to false) you have two options:
- Prepare your data before you run the test (this is viable only if data can stay on disk and then simply loaded during test initialization).
- Save values into the main
AppDomain. To do it you need to write your ownMarshalByRefObjectand expose it to other domains throughAppDomain.SetData(), like this:
AppDomain.CurrentDomain.SetData("__BenchmarkCrossDomainData",
    new MyCrossDomainServiceRepository());
Note that cross-domain communication is slow then it must be done only inside setup/cleanup methods, also don't
forget that data you exchange must be derive from MarshalByReRefObject or marked as [Serializable].
##Statistics
This tool provide just one simple implementation for measures analysis, I don't think we need advanced
statistical methods for simple microbenchmarks then a naive average may be enough. Proposed BasicStatistics
implementation also calculates few dispersion indices, they may be useful to determine benchmark quality
but also to have a better view of what happen in a complex scenario like this one:
public sealed class Benchmark {
    public void SerialDownload() {
        foreach (var fileToDownload in GetFilesToDownload()) {
            DownloadFileWithHttp(fileToDownload.LocalPath, fileToDownload.ServerUrl);
        }
    }

    public void ParallelDownload() {
        Parallel.ForEach(GetFilesToDownload(), fileToDownload =>  {
            DownloadFileWithHttp(fileToDownload.LocalPath, fileToDownload.ServerUrl);
        });
    }

    public void LimitedParallelDownload() {
        var options = new ParallelOptions { MaxDegreeOfParallelism = 4 };
        Parallel.ForEach(GetFilesToDownload(), options, fileToDownload =>  {
            DownloadFileWithHttp(fileToDownload.LocalPath, fileToDownload.ServerUrl);
        });
    }

    // ...
}
Note that statistical analysis is not mandatory and you may have an OutputRenderer which directly
work with raw measures produced by BenchmarkEngine. See for example #4.
To increase measure quality BasicStatistics implementation provides a CutTails property which
enable a trimmed average where best and worst results (one for each tail) are ignored. If you wish
to visualize also JIT compilation overhead (setting BenchmarkEngineOptions.WarmUp to false) then
you probably also want to keep this property to false.
##Output
Default OutputRenderer implementation is for an HTML document. Performance report is
generated from a template file (preprocessed with mustache-sharp and it uses Bootstrap and Highcharts). You can write your own templates
to customize report content and appearance or directly modify DefaultTemplate.html. Plain text
reports are supported through TextOutputRenderer base class (which is also the base implementation
for HtmlOutputRenderer.
HtmlOutputRenderer has only two public properties: Statistics to set the set of analysis to
perform and TemplatePath to set the full path of the HTML template to use to generate output report.
If you want to analyze raw data you can use ExcelOutputRenderer (which ignores Statistics property and always
exports all measures).
##Notes
There may be cases where an averaged value is too small to be significative, you see a big dispersion or rounding errors are not negligible. In those cases you should be careful to read benchmark results and you may want to interpolate different benchmarking methods. If execution time is very short it may be significative to compare cumulated results:
var engine = new BenchmarkEngine(new BenchmarkOptions(),  new Type[] { benchmarkType });
var benchmark = engine.Execute().Single();

var measures = benchmark.Methods.Select(method => method.Measures.Sum());
In this example measures is an enumeration (where each item is the sum of all the execution times) and it may show a more significative difference between tested methods.
Do not forget you are comparing a cumulative value: 10 ms for a test repeated 1000 times may not be as high as it seems.
Currently this engine does not support a direct measure of full execution time repeating test methods N times without re-creating object instances (useful to limit rounding errors),
you may get some useful results disabling AppDomain isolation and checking Bechmark.ExecutionTime. In this case do not forget to
set a very high number of executions and to avoid initialization/cleanup methods with attributes (use ctor and IDisposable.Dispose as requried) because they are invoked through Reflection (skewing results).